

Introduction
The Paris Olympic Games were held between July and August 2024. It is a good time now in October 2024 to reflect on the performance of various countries.
The question that keeps coming to the mind, keeping aside individual athlete brilliance, is – ‘What macro-economic factors can be attributed to the medal tally?’
When reading up on this topic, most research accounts include the past performance in the Olympic Games as an attributed lag indicator (i.e., prior Olympic year medal count). This may be possibly rightly so, as the tally cannot shift significantly between Games, given that top talent is a process that is built over time.
Nevertheless, a important improvisation in this point-of-view is an attempt to identify key drivers, using Python Machine Learning (ML) libraries, without the usual approach of including past performance as an independent variable.
Approach
- Obtain key country-specific macro-economic indicators and Olympic Games information from standard sources (largely from the World Bank and Olympic Games websites).
- Cleanse the data, addressing for certain data not being available, including referring to category averages on an exception basis, data coercion, etc.
- Explore data looking for patterns and correlations.
- Run the ML algorithm of choice and interpret results.
Methodology
- Linear Regression / Ordinary Least Squares (OLS) in scikit-learn (sklearn) and statmodels.
- Exogeneous variables used: Country-wise Population, Gross National Income (GNI), GNI per capita, Gross Domestic Product (GDP) growth %, Poverty %, Female participation in workforce %, Life expectancy, Government expenditure as % of GDP (note that this excludes the lag indicator of Olympic medals won in the previous Games, i.e., the methodology excludes the no. of medals won in Tokyo 2020).
- Endogenous variable: Olympic medals won in 2024 at Paris.
Note that other ML models can also be used as referred below (will explore this later, if required) – refer note on ‘Potential further improvements in methodology’.
Key Findings and Conclusions
The models were able to explain c.75% of the variance, while using the sklearn regression model and the statmodels OLS approach. This is to be expected, as they are one and the same.
Two runs of the models were performed – including countries with 0 medals, and excluding countries with zero medals; summary of which is presented below.
The conclusions drawn are that GNI, GNI per capita, Population are relatively the most causal factors that drive Olympic medal performance.
| Parameter | Scenario 1: Including countries with 0 medals | Scenario 2: Excluding countries with 0 medals |
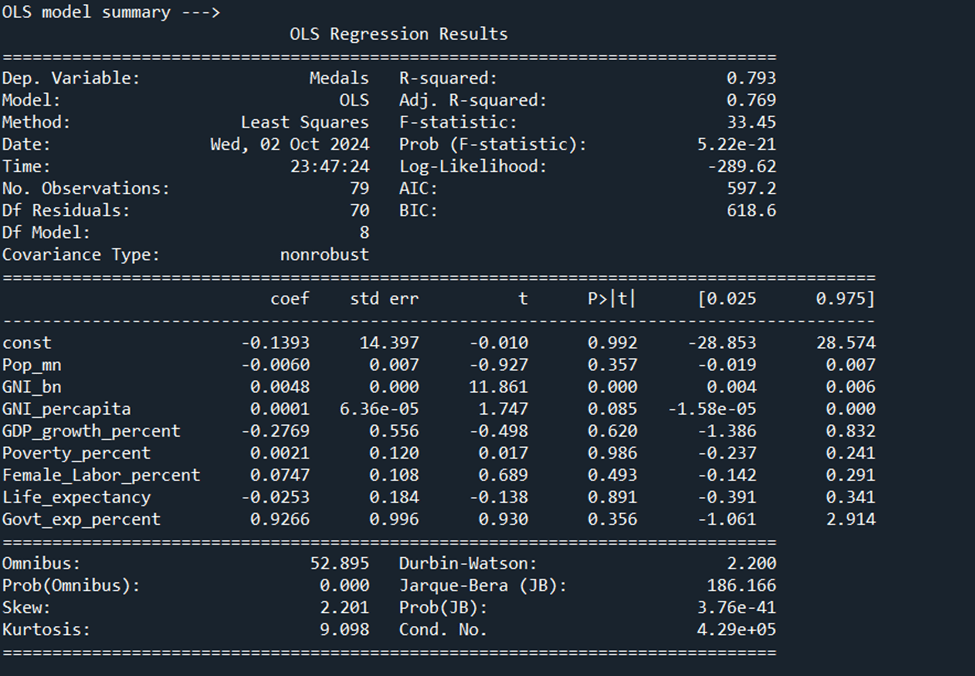
| R2 (R-square) | 74.8% | 79.3% |
| Kendall correlation (top 3 variables with highest correlation to medals tally) | GNI, Population, GNI per capita | GNI, Population, GNI per capita |
| Pearson correlation (top 3 variables with highest correlation to medals tally) | GNI, Population, GNI per capita | GNI, Population, GNI per capita |
| Variables with least standard error | GNI per capita, GNI, Population | GNI, GNI per capita, Population |
| Most significant variables | P value <0.05 GNI, Population | P value < 0.10 * GNI, GNI per capita |
| Akaike Information Criterion (AIC) | 1123 (higher since countries with 0 were included) | 597.2 (lower since countries with 0 were excluded) |
* additional flexibility was permitted as the standard error was low for GNI per capita
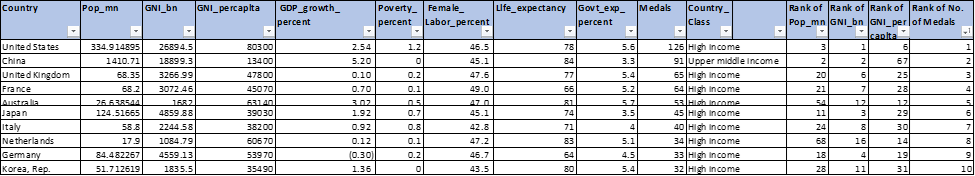
Intuitively, this seems understandable, as the top 10 countries are those with high absolute GNI as well as reasonably high GNI per capita indicative of a high income (or at least an upper middle-income economy), and those countries that do not have a small population.
Ranking top 10 by number of medals
Modeling approach using Linear Regression / OLS including countries with 0 medals

Modeling approach using Linear Regression / OLS excluding countries with 0 medals
Challenges
The following are some of the challenges faced in pursuing the specified objective:
- A large number of countries with zero medal tally.
- The approach adopted of dropping the lag indicator of past performance.
- Potential multicollinearity.
- Impact of economic system (democracy, communism / formerly communist) not used for modeling.
- Variables such as actual expenditure on sports, etc. not available for a wide range of countries / not used for modeling.
Note: Additional detailing is available but out of scope for this summary to address exceptions (such as India, attributable to low per capita, among others).
Potential further improvements in methodology
The following are potential further improvements in the modeling methodology that may be pursued subsequently:
- Exploring further classification / regression ML algorithms, such as Random Forest, Gaussian Naïve Bayes, Logistic, Poisson, Tikhonov regularization, etc.
- Modeling using different methodologies based on classifications.
- Analyzing models with the lagged indicator and / or a broader time horizon.
- Adopting enhanced data cleaning approaches.
- Exploring country-specific causal relationships, and exceptions.
- Reviewing sports-specific categorization, example, swimming, track-and-field, team sports.
Detailed information for reference
Information presented here is only for the approach that includes countries with 0 medals. Similar analysis was conducted for the approach that excludes the countries with 0 medals.
Pair-wise plots

Refer the row with Medals plotted against other variables – certain relationships are observable as regards finite increases in medals with increase in GNI and GNI per capita.
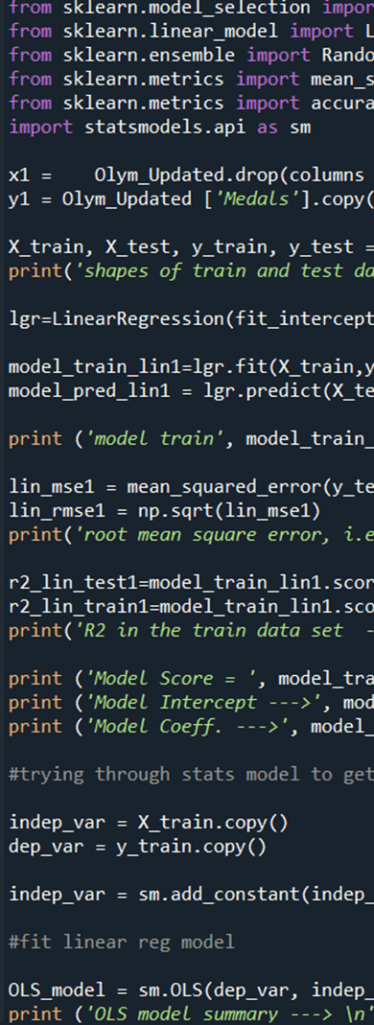
Code snippet
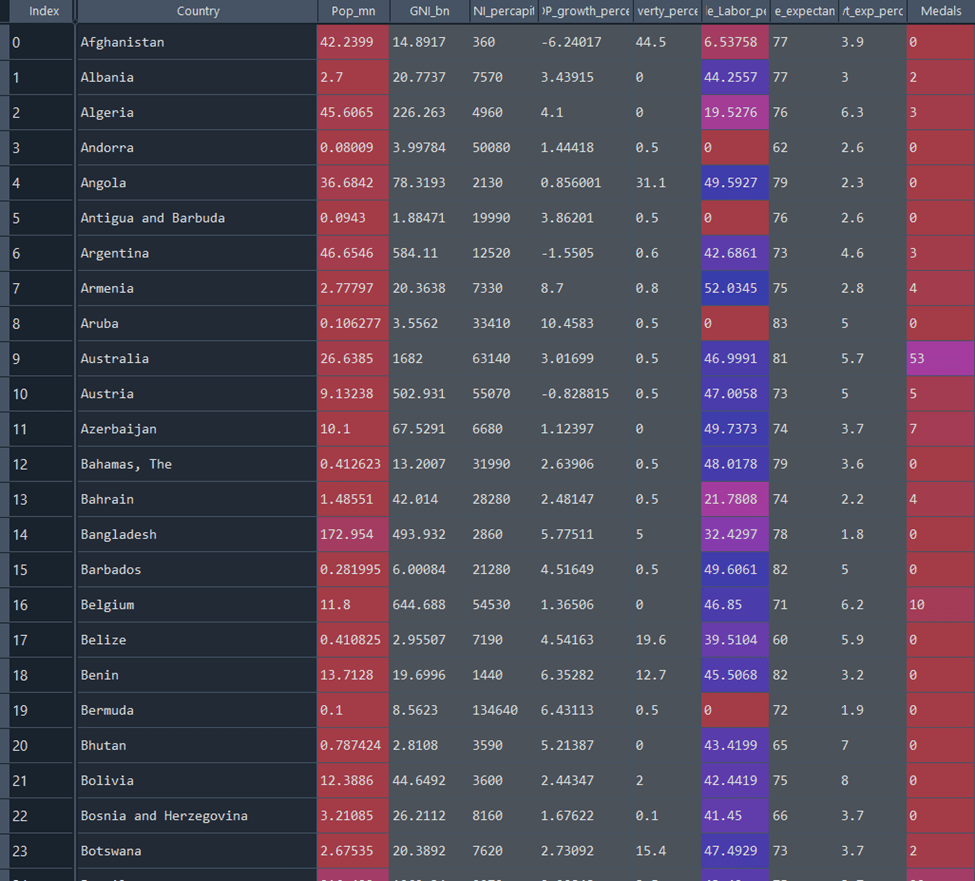
Cleansed data set
This is an extract of the cleansed data set.
Data sources
Illustrative and not exhaustive
Discover more from AnandWrites
Subscribe to get the latest posts sent to your email.
