


The Paris Olympics of July-August 2024 is still fresh in everyone’s memory, and it is a good time for introspection. In this article, leveraging Machine Learning (ML) tools, let us try to answer the question of what it will take for an aspiring nation to get into the Olympics Big League.
Note: This is a further deep-dive to identify core clusters and drivers over and above my earlier post here.
Methodology:
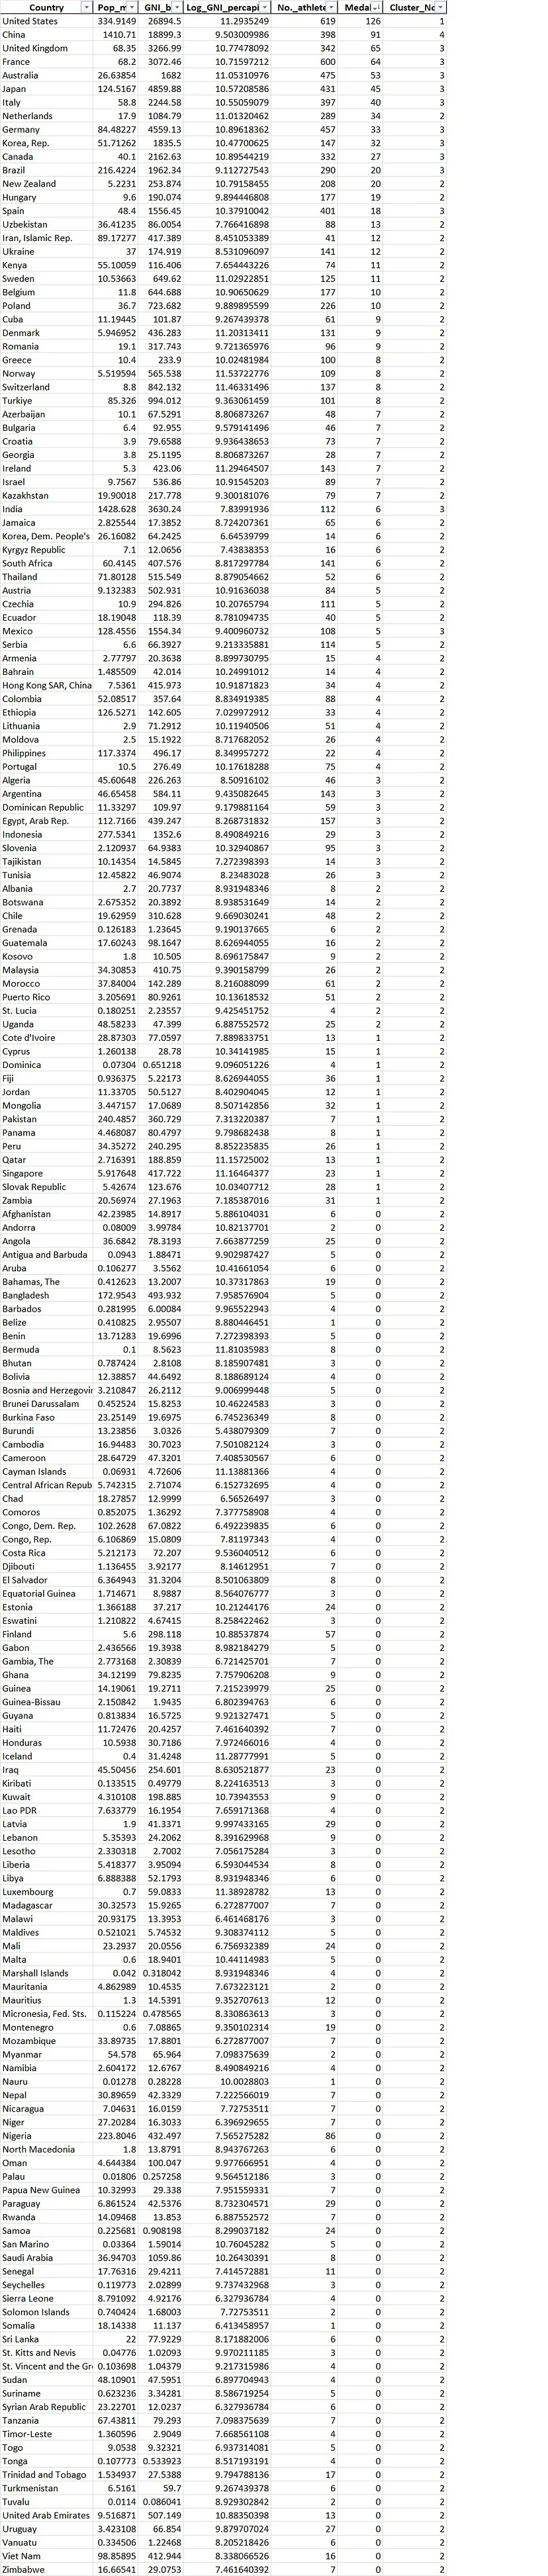
The relevant data was obtained from established sources in the public domain, mainly, World Bank Open Data and the Paris Olympics from Olympics.com, and cleansed where required, supported by relevant data-related techniques.
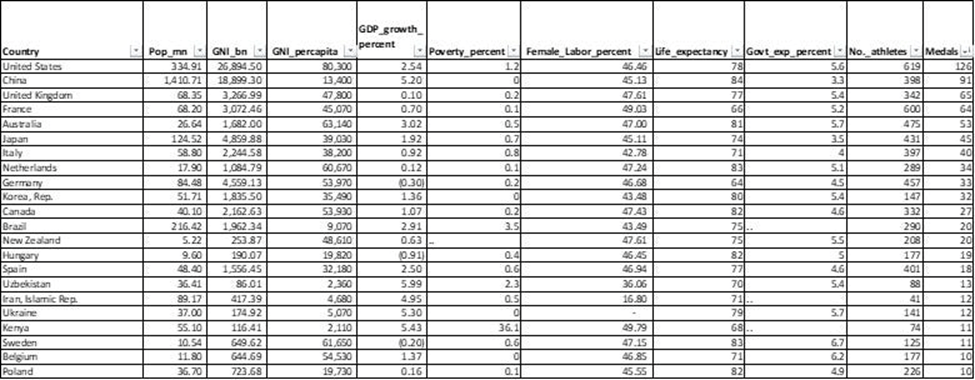
A wide group of country-specific socio-economic and Olympic-specific variables were used, namely: Population (million), Gross National Income (GNI, US $ billion), GNI per capita (US $; log-scaled), Gross Domestic Product (GDP) growth rate (%), Poverty rate (%), Female participation in labor force (%), Life expectancy (years), Government expenditure as % of GDP, the number of athletes in the Olympic Games, and the total medals won in the 2024 Olympics.
Figure 1: Sample Extract of Data
Correlation functions were used to understand the degree of relationships between variables. Linear Regression / Ordinary Least Squares (OLS) and KMeans Clustering ML algorithms were used to assess the key factors that influenced the medals tally.
The uniqueness of this methodology is that lagged medals tally (past performance) has not been considered in the modeling approach. Furthermore, a wide group of socio-economic attributes have been assessed for significance. Code snippets and key outputs are presented for ease of reference.
Summary Findings:
If a nation has to break into the Olympics Big League, it has to:
- Enhance its economic standing.
- Compete with larger sized Olympics athletics contingent.
- Commit to the long haul.
Read more details in the following sections to see the natural clustering among participating nations using ML.
Key Factors Driving Performance:
We define ‘Olympics Big League’ indicatively, as those countries which have a tally of about 20+ medals in total or are positioned in the first 10 to 15 ranks across countries by total medals earned.
The variables were assessed for correlation using various methodologies. The top 4 factors across countries that had a relatively higher correlation with the outcome of total medals won were: the no. of athletes, GNI, population, and GNI per capita.
Figure 2: Correlation Functions
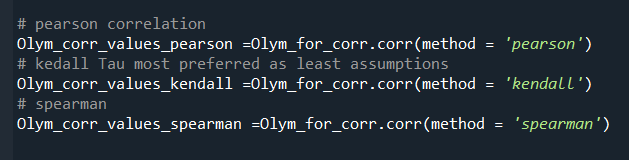
Figure 3: Pearson’s Correlation
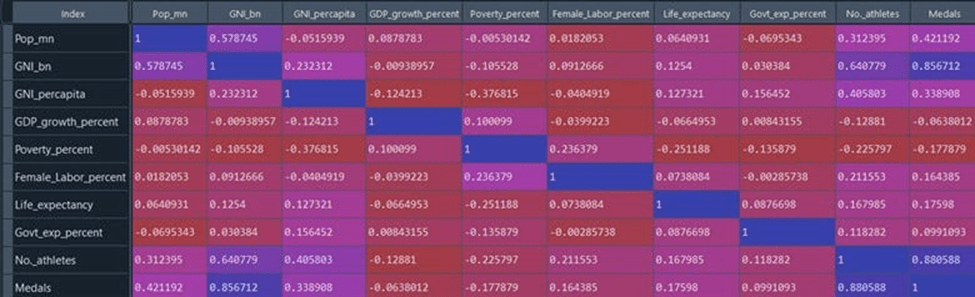
Figure 4: Kendall’s Correlation

Figure 5: Spearman’s Correlation
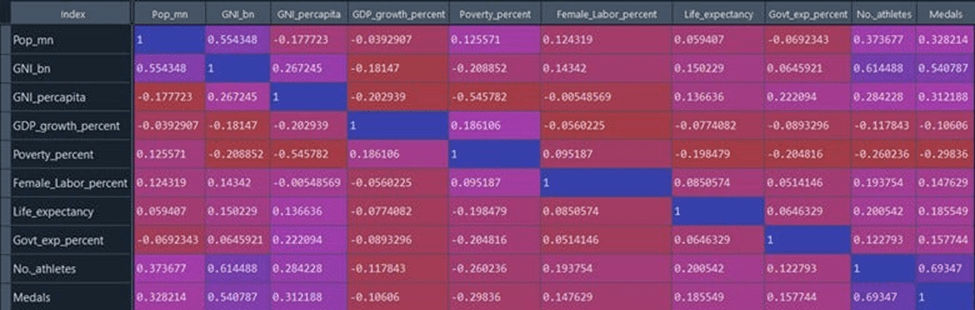
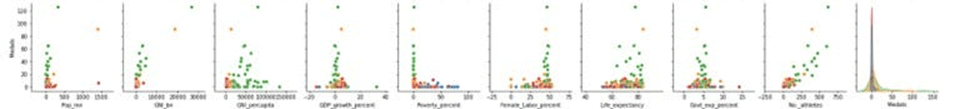
Figure 6: No. of Medals vs Other Variables
Linear Regression / Ordinary Least Squares:
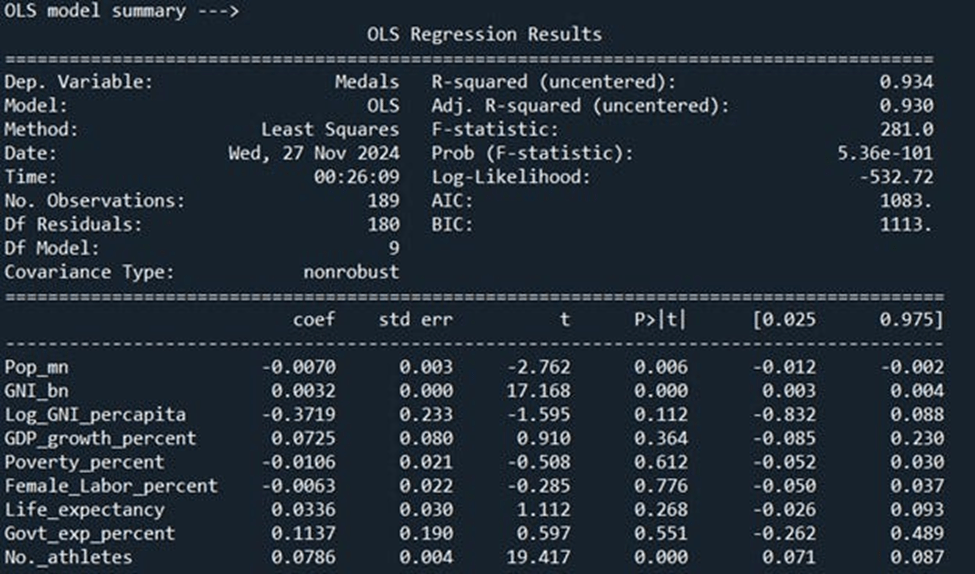
The Ordinary Least Squares (OLS) model, which leverages Linear Regression, had high explainability, with R-squared and adjusted R-squared of over 93%, high F-statistic, and high Akaike Information Criterion (AIC). Certain dependent variables, namely, no. of athletes, GNI, Population had the highest degree of significance (p-value < 0.05 and low standard error). The logarithm-scaled GNI per capita was also considered for further analysis considering its relative reasonable significance holistically, keeping in mind the correlation results as well.
Figure 7: OLS Code

Figure 8: OLS Results
KMeans Clustering and Findings Explained:
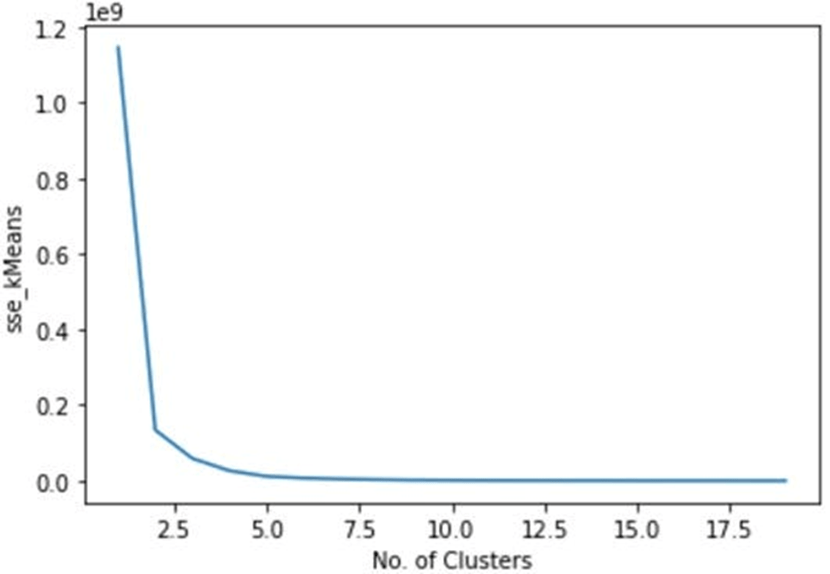
The elbow method (when the error terms flattened out) was used to find the optimal number of clusters for KMeans Clustering.
Figure 9: KMeans Elbow Method
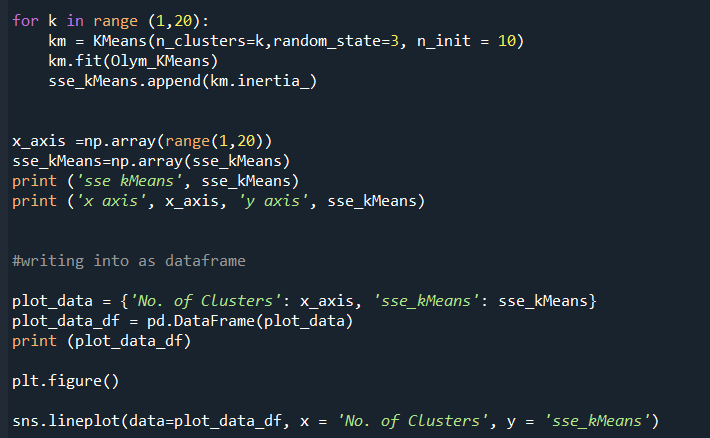
Figure 10: Optimal No. of Clusters
Broadly, the following groups naturally emerged as classified by the algorithm:
- Cluster 1 (consisting of 1 country): This single-country cluster comprised of the United States, which won the maximum total no. of medals, sent the maximum no. of athletes, had a large population, very high GNI and GNI per capita.
- Cluster 2 (consisting of 170+ countries): This comprised of a large number of countries generally characterized by relatively small populations, low absolute GNI, with high and / or low GNI per capita, and a relatively low / very low medals tally. A large pool of 160+ countries in this category had less than 10 medals, in addition to a few exceptions specified below. This cluster included certain exceptions, i.e., a few countries with a sizeable medals tally, such as Netherlands (34 medals), New Zealand (20 medals), and Hungary (19 medals), which may have got clubbed with this cluster on account of having absolute low GNI and low population. However, note that these exceptions generally sent a large Olympic contingent, more than 150+ athletes and had a higher GNI per capita compared to the rest of the large pool of members within this cluster.
- Cluster 3 (consisting of 10+ countries): This cluster comprised of countries with high GNI, high GNI per capita, a sizeable population, a large contingent (close to 300 or substantively above athletes), and won over 30+ medals on an average. This group had only 2 exceptions, namely Mexico and India, which the KMeans algorithm may have included due to high GNI in absolute terms. However, note that these two countries also won the least no. of medals in this cluster category.
- Cluster 4 (consisting of 1 country): This single-country cluster comprised of China, which won the second largest no. of medals, sent a very large contingent of athletes, had a very high GNI and a moderately high GNI per capita.
Figure 11: Clusters based on Olympics Performance
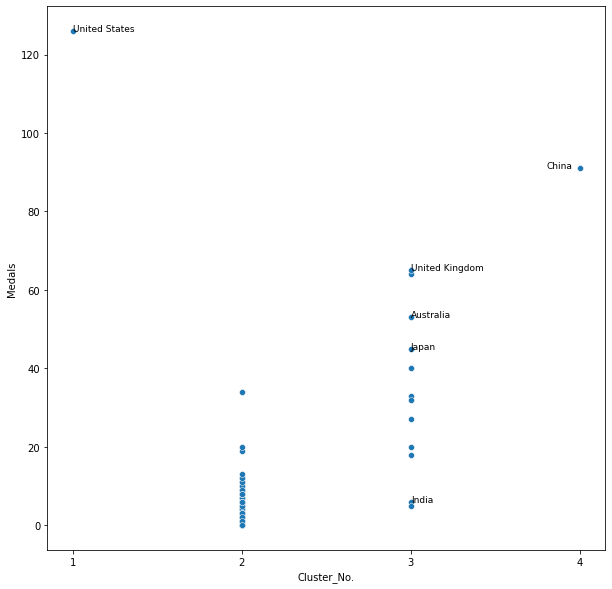
Figure 12: Country Clusters based on Significant Attributes
Key Findings – What will it take for an aspiring nation to enter the Olympics Big League?:
The above analytical approaches using ML provide significant insight toward assessing the key variables to focus that will enable an aspiring nation to appear in the Olympics Big League, targeting a sizeable handful of medals (about 20+). The interventions needed are as follows:
- Enhance economic standing: Almost all countries in the top 15 are at least upper middle income or high income countries with high GNI and high GNI per capita. Most countries across Cluster 1, 3, and 4 have a combination of these. Exceptions discussed above also fit within this rationale. It is, therefore, likely that, as a nation strives to become an upper middle income economy, its Olympics performance can improve. This can happen when the GNI per capita increases to the range of at least US $ 4,500 to 14,000, requiring sustained economic growth.
- Compete with larger sized Olympics athletics contingent: It is noted that in the results of the OLS as well as of the KMeans Clustering, the size of the Olympics contingent (no. of athletes) is a key determinant of success. Countries in Cluster 1, 3, and 4 have sent an average of 400+ athletes, in general (reasons for exceptions have been explained earlier). Therefore, as a country increases the size of its Olympics contingent by sending a larger number of quality athletes, it can aspire to likely enhance its medals tally. This can be possible when there is a substantive increase in public and private investment in sports.
- Commit to the long haul: While the above two inferences were direct inferences of the algorithm run, research on the subject also allows one to infer that the other critical element is ‘time’ — for the power of success to start compounding and becoming sizeable. It is noted that overall set of countries comprising the top 10 / top 15 positions in the Olympics medals tally have remained fairly static over the last two decades, with minor changes within this top performing category — a time-series view of the rankings will reveal this. For a nation to make inroads into this league, the following are required: a) providing more world-class sports infrastructure, b) grooming sporting talent right from county / district levels, c) hosting international-level athletic events (including the Olympics) — all factors that require commitment over a sustained period of time. It is also required that the citizens of the aspiring nation should encourage children to explore various forms of athletics to build a truly sporting culture — in essence, a mindset change as well.
It is inferred that the contributing factors detailed in this section drive Olympic performance. It is hoped that this analytics-driven deep dive into the keys for success in the Olympics makes not only interesting read, but also drives aspiring nations to action.
Hope you enjoyed this post.
Image Credit (for the Image at the top): Olympics.com – Eiffel Tower Stadium.
Discover more from AnandWrites
Subscribe to get the latest posts sent to your email.
